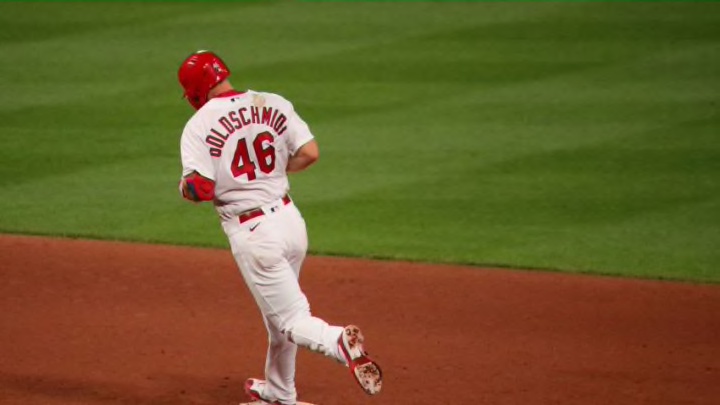
Paul Goldschmidt has been on fire for the St. Louis Cardinals, but looking past his baseline numbers, things are very interesting for the star.
St. Louis Cardinals baseball, like the rest of 2020, has just been weird. Whether it’s the shortened season, the DH, or the small sample sizes, it all just feels abnormal. No matter how we feel about it, the fact remains that any baseball is better than no baseball.
At the moment, the Cardinals are a fun team to watch in part because of the year Paul Goldschmidt is having.
Last year, in Goldy’s first year with the team, the six-time All-Star did less than what most fans expected. Digging a little deeper, you’ll find that even though he hit well below his career numbers in everything except homers on the year, Goldy was himself in the second half. Fans were looking forward to what 2020 would bring from the 32-year-old star.
19 games into the season, Goldy has been electric. Even though he only has three homers thus far, Goldschmidt has a slash line of .344/.487/.525. That is good for a stellar 184 wRC+ and .441 wOBA.
Goldy’s 1.012 is not carried by his slugging like most players with an OPS over 1.000. He’s slugging over .500, but his .487 OBP is what is so unbelievable right now. That .487 mark is first in the MLB, 27 points above the next closest player, Bryce Harper. Goldy’s OBP stems from the fact that he is bottom five in Zone percentage. Close to 65% of the pitches Goldy has seen this year have been balls.
Goldschmidt deserves plenty of credit for his pitch selection and taking what the pitcher is giving him. However, when digging deeper, a large portion of Goldy’s success this year can be pinned on a couple of different things.
Digging in
Let’s get the vanity advanced metrics out of the way first. Goldy has not been hitting the ball that hard on average. He ranks in the 15th percentile in exit velo, 44th percentile in hard-hit percentage, and 51stpercentile in barrel percentage. His strikeout rate is just 16.7% and his walk rate is 21.8% which goes back to the “pitchers aren’t throwing him strikes” point.
Ask any casual sabermetrics fan about those exit velo numbers and he will likely say Goldy is getting lucky. He may be right. But the one thing Goldy is doing at an elite level this year is hitting line drives.
By Statcast’s own definition, sweet spot percentage captures any ball hit at an exit angle between 8 and 32 degrees. Statcast defines a line drive as anything between 10 and 25 degrees, putting sweet spot percentage is just outside of those bounds.
More from St Louis Cardinals News
- Cardinals: Tyler O’Neill not going anywhere this offseason, report says
- MVP voter listed Cardinals’ Arenado 8th on ballot
- St. Louis Cardinals non-tender former All-Star closer Alex Reyes
- St. Louis Cardinals sign Oscar Mercado and four others to MiLB deals
- St. Louis Cardinals: Paul Goldschmidt named 2022 NL MVP
Goldy currently has a sweet spot percentage of 47.9%. That is by far the highest of Goldy’s career and is well above the MLB average of 32.8%.
In games, this high sweet spot percentage mixed with Goldy’s lower average exit velo leads to liners that are high enough to get over the heads of the infielders, but not hit hard enough to get caught by outfielders.
As a result of his low average exit velocity though, Goldschmidt’s barrels are way down. A barrel is defined as any ball hit with comparable hit types have led to a minimum .500 batting average and 1.500 slugging percentage.
Right now, Goldy has a three-year trend where his barrel percentage has been falling. That is slightly troubling, but his elite sweet spot percentage tells us he is at least squaring the ball up well.
Disclaimer
First, this is all still a very small sample size. There are also very legitimate concerns about how the Statcast system is working right now. This year, MLB took the full leap away from Trackman over to the Hawkeye tracking system which has been clearly off sometimes. Case in point, this Paul Goldschmidt homer into Big Mac Land had an expected batting average of just .350. I don’t know about that one.
Other people have noted other Statcast measurements that just seem off this year, so this whole argument can be taken with a huge grain of salt. Because the measurements may be off, that could explain why Goldschmidt’s barrels are way down.
Another possible explanation as to why Goldy isn’t hitting the ball as hard could be because it was simply tough to keep his strength up during the various down-periods this year. Never has there been a season like this and this could just be one way we are seeing the downtime the Cardinals had come out. It also could be a big change for Goldy to be facing so few strikes.
At the end of the day, we can see just by watching Goldschmidt in the box that he is more comfortable, more balanced, and more confident at the plate. There aren’t numbers that describe that, but watch a few games and you’ll be able to tell.
At the end of the day, there are too many variables to diagnose if Goldy’s production is due for regression or if he’s for real. We know that he is squaring the ball up and we know he is being fantastically selective at the plate. Both of those sit as great indicators of success on their own. At the end of the year, these things all work themselves out. For now, we are seeing a much better version of Goldy than we saw last year.
