There have been a lot of discussions about last year’s team. What we are hearing from the front office is it was a one-off. Everything that could have gone wrong did. But why did it go wrong?
To determine if this was bad luck, or if the whole team experienced a group funk and 2023 constituted an anomaly, I felt it was time for another “Cliff Dive” into the numbers. Let’s look at the last three years and analyze one limited part of last year’s collapse, focusing on why scoring decreased.
Expectations would be the Cardinals’ win rate would be like previous seasons if we look at batting averages. In the last three years, the team Batting Average was .244, .252, and .250. The league average was .244, .243 and .244. The Cardinals remained consistent, performing at or above league average for all three years. OPS+ was very similar. The Cardinals’ OPS+ was 99, 112, and 101, and the league average for those three years was 97, 100, and 100. Again, all three years, the Cardinals were better than the league average.
So what went wrong? How can a team have the same number of hits and be above the league average over three years but experience a drop in run production? Runs scored for the Cardinals were 706, 772, and 719. The league average was 734, 694, and 748. The team experienced a decline from 78 runs above the league average to 29 runs below average in one year. That is a seven percent decrease. The league increased by eight percent. That equals a fifteen percent swing.
What becomes clear is that despite equal base runners, the Cardinals stranded more, revealing a pattern. For the last three years, LOB was 1,081, 1,132 and 1,183. The league average LOB was 1,087, 1087, and 1,099. While the rest of the league has been stable, the Cardinals left 51 more runners on base in 2022 over 2021. They then left another 51 runners on in 2023 compared to 2022. More runners on base would make a higher LOB acceptable, but that’s not happening. The Cardinals ranked 30th in run-scored percentage.
One possibility is the Cardinals failed to get the runners into a scoring position, unlike in previous years. However, those numbers were not far enough apart to be the reason for the drop-off. One revealing stat from Baseball-Reference is XBT% — Extra Bases Taken Percentage (Percentage of times the runner advanced more than one base on a single or over two bases on a double, when possible). The Cardinals ranked 27th. This reflects more on the runner or the coaches directing the runners than it does on the batters. So being too cautious could be a part of it.
Sometimes doing deep dives, looking at lots of data, and trying to make sense of numbers that aren’t adding up, the most obvious answer gets overlooked. Here, that would be the RBI guys just aren’t driving in runs like they used to.
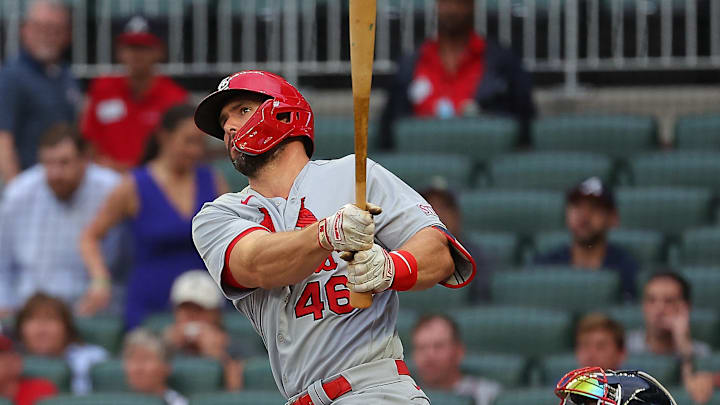
In 2021, the number one and number two RBI leaders were Nolan Arenado with 105, and Paul Goldschmidt who had 99. During 2022, it reversed, with Goldschmidt driving in 115 runs and Arenado with 103. In 2023, the RBI leaders were the same two, with Arenado driving in only 93 and Goldschmidt only driving in a mere 80.
To find out why there was such an immense decline, we need to look no further than what is happening when they find themselves with an opportunity to drive in a run. With runners in scoring position (RISP), Goldschmidt’s batting averages over the last three years were .331, .308, and .255. Arenado achieved batting averages of .329, .290, and .258 when runners were in scoring position. This makes three years in a row that the top RBI guys are trending in the wrong direction. That is a 76-point drop for Goldschmidt and a 70-point drop for Arenado. That is not insignificant.
In 2021, the Cardinals had no one with better averages with runners in scoring positions than Goldschmidt and Arenado. In 2022, only two players had better averages with RISP. They dropped so much last year that Willson Contreras, Brendan Donovan, Lars Nootbar, and Nolan Gorman all had higher batting averages with runners in scoring position. There were more, but those were hitters that had over 50 chances.
Two things have converged at the same time.
First, the Cardinals as a team aren’t helping themselves. I wrote this article laying out how the Cardinals are near the bottom in some categories that show a lack of aggressiveness. If they were stealing more bases, hitting more sacrifice flies, and bunting more, that would have helped. A better transition from first to third, or better yet, score from second without stopping at third, would help even more. All this would increase the runs scored.
Second, the batters this team relied on for RBIs in the past are trending in the wrong direction. This is not a slight at Goldschmidt or Arenado. It’s just what the data is showing.
How can the team score more runs with the same offense this year? The Cardinals need to be substantially more aggressive and also find some way to get Gorman, Nootbar, Contreras, Donavon, and even Walker more opportunities to drive in more of those runners, even if it means getting creative and changing the lineup from time to time.
