How does Oli Marmol compare to other Cardinal managers?

The stats show that Oliver Marmol could be the worst manager the Cardinals have had in years.

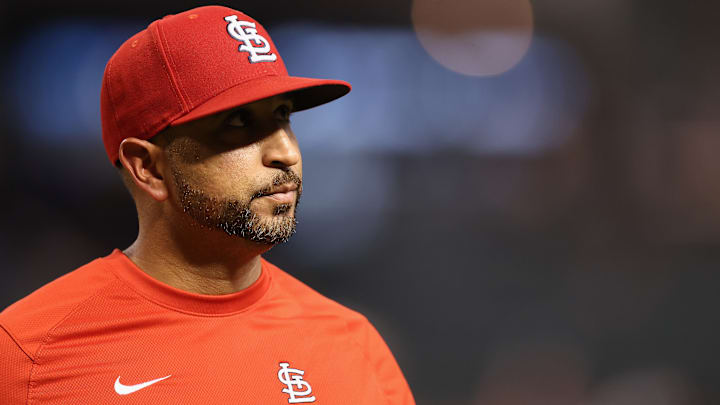
St. Louis Cardinals v Arizona Diamondbacks
St. Louis Cardinals v Arizona Diamondbacks / Christian Petersen/GettyImages
3 of 4
Next

Is Oliver Marmol the worst manager the Cardinals have ever had?

When your team has been in existence since 1882 it’s a pretty good bet that over the years they have had worse. Much worse. I think John McCloskey might just have that honor. He managed from 1906 through 1908. He won 153 games and lost 304. So with a won/loss percentage of .335 and 151 games under .500, he will probably hold on to that record for a while.

However, if I change my question to “Is Oliver Marmol the worst Cardinals manager that anyone under 28 years old has ever seen?” the answer is a resounding yes. It’s okay to reread that sentence. Yes, that takes you back to the Joe Torre days. To be fair to Torre, at the time he managed the Cardinals from 1990 to 1995 they had just been sold by Gussie Busch to Anheuser-Busch. The Brewery at the time wanted nothing to do with the Cardinals and wasted all of Torre’s time here trying to sell the team instead of investing in it. After Torre left he won four World Series and two Manager of the Year awards. So, if we can say that Torre was a better manager than Marmol, (and I will), and since the manager before him was Whitey Hertzog, that takes us even further back to 1980. For those of you without calculators, that is 43 years ago.

MANAGER

YEARS

FROM

TO

WINNING %

Oliver Marmol

2

2022

2023

.511

Mike Schildt

4

2018

2021

.599

Mike Matheny

7

2012

2018

.555

Tony La Russa (HOF)

16

1996

2011

.544

Joe Torre (HOF)

6

1990

1995

.498

Whitey Herzog(HOF)

11

1980

1990

.530

Granted, it’s not just a winning percentage that makes someone a good manager. There are intangibles such as trust, honesty with the players, preparation, and I get all that. Not being in the dugout every day I can’t tell you if any of those boxes are checked. I guess we could check with Tyler O’Neill or Wilson Contreras and see what they say.

I also know you are looking at this and saying “But he can only work with the players he was given.” I’ve even seen that written on this site. However, that applied to everyone on this list other than Whitey who also held the title of general manager. It also applies to the other 31 managers that are currently managing other MLB teams. All managers today can only work with the players they are given. It is the manager’s job to take those players, put them in positions to succeed, and make the sum greater than the parts. Some are just better at that than others.

What about the things we know a manager can control? What is the identity of this team? We know Herzog was all about speed and defense. Schildt was all about fundamentals and being prepared. On the pitching side, La Russa was one who would let his pitchers pitch to contact and let the defense do its thing. Those teams took on the personalities of their manager. After two years, I am still not sure what the essence of this team is.

Since context matters it wouldn’t be fair to compare the number of stolen bases of a Whitey team to this one. But we could compare this team, this year, to the other 31 teams. We can’t use something like home runs because that isn’t something a manager can call for. He can, however, call for the batter to bunt or hit a sacrifice fly. A manager does decide when to change pitchers in a game. Do you let the runner steal a base to get into scoring position? How do you set the lineup? It’s time to see if we can answer some of those questions about Marmol.

Team hitting stats under Marmol

Getting on base is not the manager’s job. He is not the hitter or the hitting coach. This is all on the batters. They are doing a good enough job of getting on base. The Cardinals rank 9th on OBP. We rank higher than all of the other teams in our division. The Cardinals rank 8th in walks. We have the second-best hard-hit rate only behind the Braves. Once the player does his job, and the numbers say they are, then the manager takes over. The very second the batter’s foot hits the bag, it is at that exact point the manager (through the coach ) should be determining how to get that player to cross home plate.

Let’s look at some statistics to see what is happening after the batter puts the ball in play.

Taking the extra base - Baseball-Reference has a stat XBT% -- Extra Bases Taken Percentage (Percentage of times the runner advanced more than one base on a single or more than two bases on a double, when possible). The Cardinals rank 27th. In other words, they stop the runners at first, turning doubles into singles and triples into doubles. You could blame this on the coaches but the manager is the one that ultimately determines the aggressiveness of the team.

Stolen bases - The MLB changed the rules to make it easier to steal bases this year trying to generate more runs scored. St. Louis ranks 23rd. Last year they stole 95 bases. This year with less than three weeks left we have 90. Do they just have slow players? Baseball Savant has 27 ft/sec as the average sprint speed. Edman, O’Neill, Walker, Nootbar, and Donavan all have better than average speed. Edman has 24 stolen bases. The others combined have a total of only 20. When half your lineup has above-average speed, this is a big failure. To not take advantage of what the league just gave you is negligence. At the very least, it shows complete indifference.

Bunts/Sacrifice Flies - How is this manager with moving the runner over? They are 18th in bunts and only 27th in sacrifice flies. I get that bunting has become a lost art but at this point, the question is why are they that bad at moving players over, and they aren’t doing everything they can to generate a run? Again, these are usually calls from the dugout.

Bases Taken -(Bases advanced on fly balls, passed balls, wild pitches, balks, defensive indifference). The Cardinals rank 18th. These are give-me’s that are free.

1stS3 -- (On First, when a single is hit and the runner reaches third or scores.) The age-old first to third. One of the prettiest plays in baseball. The Cardinals rank 23rd. With above-average speed, this makes no sense to me.

Pinch Hitting - They rank 25th in the league for the number of pinch hits. Baseball-Reference has a stat to pair with the number of pinch hits. Pinch Hit Leverage Index (The importance of the context in which the Pinch Hitter was used Above one means higher than average pressure. Below one means lower than average pressure. ) The Cardinals index is 2.08. The only team with a higher index is the Rays with a 2.09. So this tells me they don’t pinch-hit very often but when they do it’s only when it’s a high-pressure situation such as the game is on the line in the 9th inning. Very seldom do we see this team pinch-hit in the sixth or seventh inning to get that one extra run.

RS% -- Run Scoring Percentage - (Percentage of times a baserunner eventually scores a run.) The Cardinals ranking: 31st. Only the Oakland As are more ineffective at scoring runs than they are.

Pitching and Defense

Without a doubt the Cardinals’ starting pitching was dreadful. There isn’t a lot that a manager can do with that. However, what he does with the relievers can mitigate the outcome of a game even with bad starts from his pitchers. When to go to the pen and which reliever to bring in is one of the biggest responsibilities of a manager.

Wlst -- Wins Lost (At the time the pitcher faced his final batter the pitcher was in position for a win, but the game was blown by the bullpen ) The Cardinals are tied for the second worse.

Losses Saved (At the time of his last batter the pitcher was in position for a loss, but the team came back to tie or take the lead. ) The Cardinals are second worse.

These two stats pretty much tell the story of the season. They can’t hold a lead and they can’t seem to come back after being down a run or more.

But is this all the fault of the pitchers? I don’t think so.

Inherited Runners (Number of runners on base when pitcher entered the game.) We have the third most runners on base when a reliever enters the game.

Games Entered With Bases Empty (Pitcher entered the game with no runners on base) Only one other team has fewer times having their relievers enter the game without it being a high-leverage situation.

IPmult (Games the pitcher pitched in more than one inning ) Rank 32. No other team in baseball has their relievers pitch more than one inning than the Cardinals.

This team has the 10th-highest amount of payroll spent on a pitching staff. The Cardinals WAR with that payroll is 29th. When you wait too long to bring in the reliever and he has to be perfect or you bring him in too early and make him pitch more than one inning bad things will happen. When you turn relievers into starters and starters into relievers as we have done this year, that only complicates things even more.

Defense

If you have a great defense that will cover up a lot of pitching inefficiencies. Outs Above Average we rank fourth from the bottom with a -26. Defensive Efficiency (Percentage of balls in play converted into outs) We are dead last.

I wrote a complete breakdown of the Cardinals’ defense here. The bottom line is that with all the Gold Gloves on this team the only way our defense is this bad is either with bad positioning or a complete indifference.
Summary

I know this is a bit longer than most articles here and I want to thank you for taking the time to get to the end. I didn’t want this to be an article that just says the manager is bad. The thing that makes baseball so special is we have all played it, we understand it, and it is a game that is shared and discussed by generations. We all yell at the television (I know you do) about taking the pitcher out or leaving him in, hit-and-runs, and all the other strategies that are a part of the game. Sometimes our lying eyes deceive us. Sometimes there are valid reasons for what the manager does. But sometimes our eyes aren’t lying.

I went into this exercise with an open mind hoping the data would contradict my feelings. Instead, my feelings were confirmed.

manual

We have really good players. We have a lot of gold glovers. What we don’t have is a good team. After seeing the data it is easy to see why we are so ineffective at scoring runs. After looking at how the bullpen is being used, and the lack of defensive focus I can now see why the pitching is so bad.

My takeaway from this is most of the stats I cited are about in-game decisions the manager of a baseball team has to make and make at the right time. Half of them are not being made at all and the others are being made at the wrong time. The lack of aggressiveness is worse to me than making the wrong move. At least that would show you are trying.

Maybe, just maybe, our eyes aren’t lying after all.

The stats I have cited here are from Fangraphs, Baseball-Reference, Baseball Savant, and change daily.

Next