Are the expert predictions right on these three Cardinals players?

What should we make of the expert predictions?

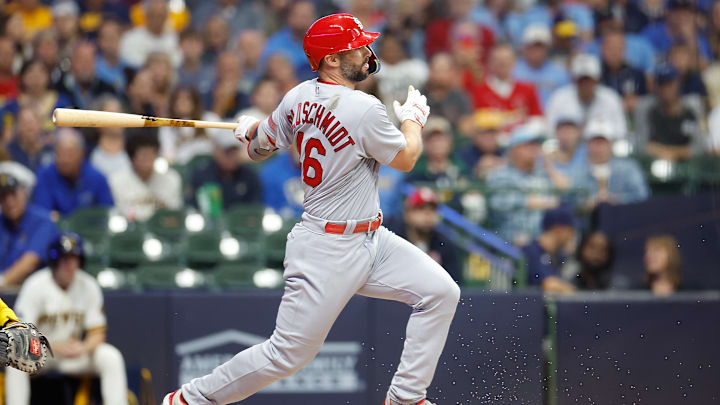
St. Louis Cardinals v Milwaukee Brewers
St. Louis Cardinals v Milwaukee Brewers / John Fisher/GettyImages
3 of 4
Next

We are now seeing a change from talking about free-agent signings to how will teams compete this season. Experts are putting out all kinds of rankings and we comb through every list for confirmation that our excitement is justified. We get thrilled when our players land at the top of those lists.

We also study those same lists and don’t trust them if they don’t put our guy as high as he deserves. How could player-x be so low this year? After all, he played hurt. Don’t they know that even though he had a terrible year, he got better at the end and that should carry over to this year?

ZiPS, Steamer, FanGraphs, Baseball Savant, and a few others do a great job of analyzing the data. While the approach may differ, all have solid methods. It can still be overwhelming with so much information to pour through.

To predict a player’s performance this year, I wanted to explore a more basic way of projecting. I also wanted to know if the experts reached the same conclusions with their big fancy computers and their massive amounts of data. Analyzing someone like Cardinals' Jordan Walker or Masyn Winn is hard because of the lack of historical data. We should, however, be able to get a pretty good idea of Paul Goldschmidt, Nolan Arenado, and Willson Contreras by looking at trends. 

I feel there are just a few things we must consider to learn if a player’s skill set is ascending or descending. As you get older, a simple fact is that eyesight weakens and reflexes slow. I can testify to both. After examining those two things, what happens when the ball gets hit? Each year, we create more and more stats. We should limit our analysis to the key indicators determining a player’s outlook. 

To find out how a player is seeing the ball, I will search for tendencies in called strikes and swinging at pitches outside the strike zone.   

To gauge reflexes, I will focus on the contact percentage and determine if the rate of missed pitches inside the zone is higher or lower.

What is happening with the balls that the player gets his bat on? Two stats give us a pretty good snapshot showing these results. “Expected Weighted On-Base Average (XWOBA)” is one of those stats. XWOBA tells the story of a player’s season based on the quality of and amount of contact, not outcomes. WRC+ quantifies run creation and normalizes it, so we can compare players who play in different ballparks and even different eras. Both stats just focus on the batter and eliminate any variance caused by defenses or ballparks. You can find complete definitions of both here.

Let’s examine three Cardinals and look at how the experts did. 

Paul Goldschmidt

LAST THREE YEARS

YEAR

HR

R

RBI

AVE

OBP

SLG

2021

31

102

99

.294

.365

.514

2022

35

106

115

.317

.404

.578

2023

25

89

80

.268

.363

.447

WHAT THE EXPERTS SAY

2024

HR

R

RBI

AVE

OBP

SLG

FG

26

93

90

.268

.358

.460

STEAMER

28

98

88

.269

.361

.467

ZIPS

23

82

84

.267

.354

.452

FORECAST USING THE TRENDS OF THE LAST THREE YEARS.

TREND

HR

R

RBI

AVE

OBP

SLG

2024

24

86

79

.267

.375

.446

If he isn’t seeing the ball as well, I would expect the number of called strikes to go up. In 2021, the percentage of called strikes was 18.6%. In 2022, 19.6%, and 16.6% in 2023.  18.9% is his career average. He isn’t swinging at pitches outside the zone either. In the last three years, O-Zone-swing% is 28.1, 27.6, and 29.1. His career average is 26.7. Since these remain consistent, I would say he is more aggressive than regressing. It looks like his command of the strike zone is still OK and still much better than most.  

How about reflexes? FanGraphs’ contact percentage for the last three years shows he is 77.6%, 76.3%, and 75.4%. The swinging strike percentage rose last year. For 2021 and 2022, it was 9.9%. Last year it climbed almost an entire percentage point to 10.8%. So this shows he can recognize the pitch, but he is missing a little more each year. One other thing to consider is to discover if he can still get around on the ball. In the last three years, his pull percentage has been 39.0% and 37.7%, and last year it decreased to 33.1%. His ground ball rate is going up also and part of that is his launch angle has dropped five degrees in the last three years and is now two degrees less than his career average.

 When we study Xwoba, we encounter a trend. During 2020 and 2021, that number was .396 and .397. In the last two years, the number fell to .367 each year. To put this into perspective, 320 is average, 340 is above average, 370 is great and 400 is excellent. He is still above average, but he is down from just below the excellent mark. This is not a one-off. This is now two consecutive years.

WRC+ - in 2020 he had 147, and in 2021 WRC+ dropped to 136. In his MVP year of 2022, Goldschmidt had a tremendous jump to 176. Last year it dropped to 122. Since a 100 is league average, his 122 was still 22% above the average baseball player. The trend line, however, is on a downward slide. 

Summary

Without a doubt, Paul Goldschmidt is still a dominant player. That isn’t the question. Only if the experts got their projections right. Goldschmidt is still seeing the ball but the reflex numbers are off a bit. The production categories are trending down. 

Given the experts’ projections are close to the same numbers that I got by looking at the trend lines and doing my forecast; the projections seem reasonable. 

CONCLUSION: EXPERTS’ PROJECTION IS FAIR

Nolan Arenado 

LAST THREE YEARS

YEAR

HR

R

RBI

AVE

OBP

SLG

2021

34

81

105

.255

.312

.494

2022

30

73

103

.293

.358

.533

2023

26

71

93

.266

.315

.459

WHAT THE EXPERTS SAY

2024

HR

R

RBI

AVG

OBP

SLG

FG

26

77

98

.263

.323

.452

STEAMER

28

83

99

.263

.323

.466

ZIPS

18

55

76

.264

.322

.438

FORECAST USING THE TRENDS OF THE LAST THREE YEARS.

TREND

HR

R

RBI

AVG

OBP

SLG

2024

22

65

88

.282

.331

.460

Called strikes were 16.3, 15.5, and 16.7. Even though that is higher than his career average of 14.6, Arenado is still quite consistent. Swings at pitches outside the zone are also consistent at 33%, 36%, and 36%. 

Contact percentages registered 83%, 82%, and 81 percent. His swinging strike percentages aren’t any more or less either. The last three years were 49%,48%, and 48%. His pull percentages were 50%, 48%, and 50%. His hard-hit rate was consistent, but the ground ball had a one-year increase last year. One stat that jumped out that may explain that is the launch angle reached 20 degrees and 21 degrees in 2021 and 2022. In 2023, his LA dipped to 16 degrees. 50%, 48%, and 50% are his pull rates.  

XwOBA - .311, .330, and .321 are the numbers from the last three years. The statistical forecast for 2024 based on the last three years is .333.

WRC+ - 112, 150, and 107 in the past three years. The forecast for 2024 based on the last three years is 118. The experts slot him at 106 to 112 

Summary

I find no reason for Arenado to have the season being predicted. He is still seeing the ball and getting his bat on the balls he swings at. He is still getting around on the ball and his production is still very high. This differs from Goldschmidt because of no prolonged downward trend. What we get from Arenado is a one-year aberration.

I think you should be able to take the high numbers from each prediction and that should be where he ends the season. 28 HRs, 83 Runs, 99 RBIs, .282 average and .466 slug. Sounds about right.

CONCLUSION: EXPERTS’ PROJECTION IS TOO LOW
Willson Contreras

LAST THREE YEARS

YEAR

HR

R

RBI

AVG

OBP

SLG

2021

21

61

57

.237

.340

.438

2022

22

65

55

.243

.349

.466

2023

20

55

67

.264

.358

.467

WHAT THE EXPERTS SAY

2024

HR

R

RBI

AVE

OBP

SLG

FG

19

60

65

.244

.338

.432

STEAMER

21

65

67

.252

.343

.454

ZIPS

16

52

57

.236

.333

.411

FORECAST USING THE TRENDS OF THE LAST THREE YEARS.

TREND

HR

R

RBI

AVE

OBP

SLG

2024

20

54

53

.275

.370

.486

Called strikes over the last three years are 16%, 12.8%, and 14.5%. His career average is 14.6. Swing at pitches outside the strike zone was 30%, 36%, and 35%, which is in line with his 34% rate. 

Contact percentages totaled 67.8, 71.6, and 73.0. The Swinging Strike percentage was 14.5%, 14.4%, and 13%. He is still getting around on the ball with a pull rate of 41%, 44%, and 38%. 

XwOBA - .346 in 2021, .364 in 2022 and .375 last year. That trend would mean he should be somewhere near .390 this year. .320 is average. 

WRC+ - 2021 was 111, 2022 was 132, and last year was 127. A statistical forecast of 140 is the result if you calculate using those numbers. FanGraphs is predicting 113, Steamer is 119 and ZIPS predicts 107.

Summary

This is the most head-scratching prediction of the three Cardinals. His average has been climbing for three years and yet they predict a 12% to 28% decrease, not a 12% increase. They predict a 15% to 25% drop in OBP even though this statistic has also been rising each year. The forecast shows more of a 12% increase. His SLUG is the same. 

Contreras is seeing the ball better than ever and is laying off pitches outside the zone. He is making contact better each year. He is pulling the ball at a consistent rate. 

With a higher slug, OBP, and average, I would expect his numbers to be much higher than what the experts are giving him credit for. 

CONCLUSION: EXPERTS’ PROJECTION IS WAY TOO LOW

Summary

Confusion. How someone like FanGraphs can pick the Cardinals to win 12 more games and finish first in the division and yet have two of their top players finish the season with lower stats than the year before makes little sense. 

I still think baseball can be a simple sport. Pete Rose and Willie Keeler were right. “See the Ball, Hit the Ball.”, and “Hit ‘em where they ain’t.” I used stats that would concentrate on those two things to predict what seasons these three Cardinals will have. 

I concluded Goldschmidt will be about the same hitter as last year. Arenado should have a better year than the experts predict and Contreras should be much better than last year, not worse.  

manual

Next