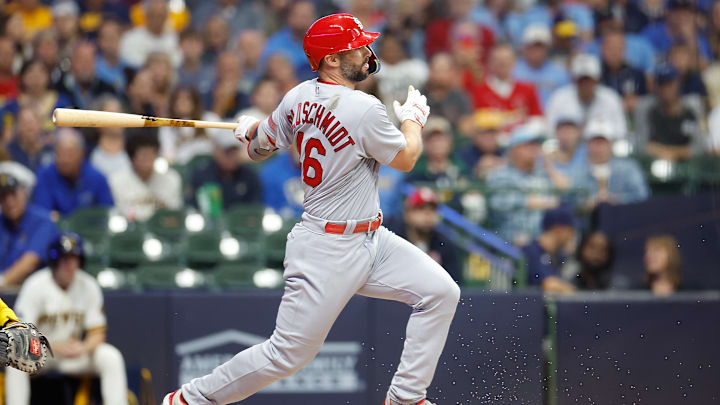
Paul Goldschmidt
LAST THREE YEARS
YEAR | HR | R | RBI | AVE | OBP | SLG |
|---|---|---|---|---|---|---|
2021 | 31 | 102 | 99 | .294 | .365 | .514 |
2022 | 35 | 106 | 115 | .317 | .404 | .578 |
2023 | 25 | 89 | 80 | .268 | .363 | .447 |
WHAT THE EXPERTS SAY
2024 | HR | R | RBI | AVE | OBP | SLG |
|---|---|---|---|---|---|---|
FG | 26 | 93 | 90 | .268 | .358 | .460 |
STEAMER | 28 | 98 | 88 | .269 | .361 | .467 |
ZIPS | 23 | 82 | 84 | .267 | .354 | .452 |
FORECAST USING THE TRENDS OF THE LAST THREE YEARS.
TREND | HR | R | RBI | AVE | OBP | SLG |
|---|---|---|---|---|---|---|
2024 | 24 | 86 | 79 | .267 | .375 | .446 |
If he isn’t seeing the ball as well, I would expect the number of called strikes to go up. In 2021, the percentage of called strikes was 18.6%. In 2022, 19.6%, and 16.6% in 2023. 18.9% is his career average. He isn’t swinging at pitches outside the zone either. In the last three years, O-Zone-swing% is 28.1, 27.6, and 29.1. His career average is 26.7. Since these remain consistent, I would say he is more aggressive than regressing. It looks like his command of the strike zone is still OK and still much better than most.
How about reflexes? FanGraphs’ contact percentage for the last three years shows he is 77.6%, 76.3%, and 75.4%. The swinging strike percentage rose last year. For 2021 and 2022, it was 9.9%. Last year it climbed almost an entire percentage point to 10.8%. So this shows he can recognize the pitch, but he is missing a little more each year. One other thing to consider is to discover if he can still get around on the ball. In the last three years, his pull percentage has been 39.0% and 37.7%, and last year it decreased to 33.1%. His ground ball rate is going up also and part of that is his launch angle has dropped five degrees in the last three years and is now two degrees less than his career average.
When we study Xwoba, we encounter a trend. During 2020 and 2021, that number was .396 and .397. In the last two years, the number fell to .367 each year. To put this into perspective, 320 is average, 340 is above average, 370 is great and 400 is excellent. He is still above average, but he is down from just below the excellent mark. This is not a one-off. This is now two consecutive years.
WRC+ - in 2020 he had 147, and in 2021 WRC+ dropped to 136. In his MVP year of 2022, Goldschmidt had a tremendous jump to 176. Last year it dropped to 122. Since a 100 is league average, his 122 was still 22% above the average baseball player. The trend line, however, is on a downward slide.
Summary
Without a doubt, Paul Goldschmidt is still a dominant player. That isn’t the question. Only if the experts got their projections right. Goldschmidt is still seeing the ball but the reflex numbers are off a bit. The production categories are trending down.
Given the experts’ projections are close to the same numbers that I got by looking at the trend lines and doing my forecast; the projections seem reasonable.
CONCLUSION: EXPERTS’ PROJECTION IS FAIR
