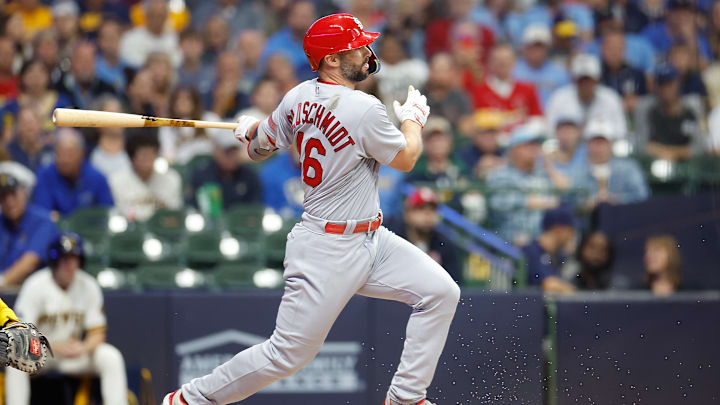
We are now seeing a change from talking about free-agent signings to how will teams compete this season. Experts are putting out all kinds of rankings and we comb through every list for confirmation that our excitement is justified. We get thrilled when our players land at the top of those lists.
We also study those same lists and don’t trust them if they don’t put our guy as high as he deserves. How could player-x be so low this year? After all, he played hurt. Don’t they know that even though he had a terrible year, he got better at the end and that should carry over to this year?
ZiPS, Steamer, FanGraphs, Baseball Savant, and a few others do a great job of analyzing the data. While the approach may differ, all have solid methods. It can still be overwhelming with so much information to pour through.
To predict a player’s performance this year, I wanted to explore a more basic way of projecting. I also wanted to know if the experts reached the same conclusions with their big fancy computers and their massive amounts of data. Analyzing someone like Cardinals' Jordan Walker or Masyn Winn is hard because of the lack of historical data. We should, however, be able to get a pretty good idea of Paul Goldschmidt, Nolan Arenado, and Willson Contreras by looking at trends.
I feel there are just a few things we must consider to learn if a player’s skill set is ascending or descending. As you get older, a simple fact is that eyesight weakens and reflexes slow. I can testify to both. After examining those two things, what happens when the ball gets hit? Each year, we create more and more stats. We should limit our analysis to the key indicators determining a player’s outlook.
To find out how a player is seeing the ball, I will search for tendencies in called strikes and swinging at pitches outside the strike zone.
To gauge reflexes, I will focus on the contact percentage and determine if the rate of missed pitches inside the zone is higher or lower.
What is happening with the balls that the player gets his bat on? Two stats give us a pretty good snapshot showing these results. “Expected Weighted On-Base Average (XWOBA)” is one of those stats. XWOBA tells the story of a player’s season based on the quality of and amount of contact, not outcomes. WRC+ quantifies run creation and normalizes it, so we can compare players who play in different ballparks and even different eras. Both stats just focus on the batter and eliminate any variance caused by defenses or ballparks. You can find complete definitions of both here.
