Advanced stats from 2021 that matter for St. Louis Cardinals

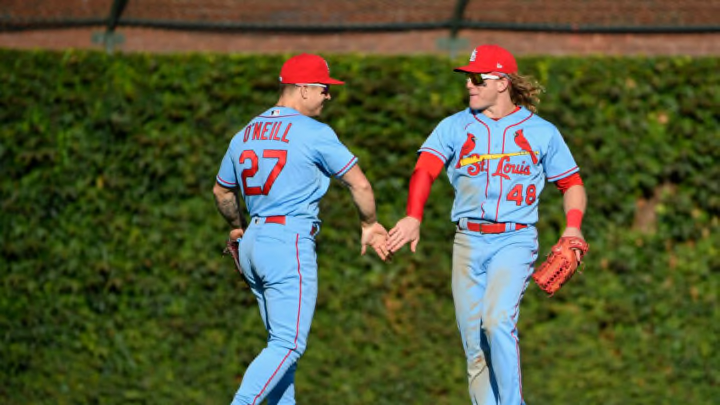
CHICAGO, ILLINOIS - SEPTEMBER 25: Tyler O'Neill #27 and Harrison Bader #48 of the St. Louis Cardinals celebrate the team win against the Chicago Cubs at Wrigley Field on September 25, 2021 in Chicago, Illinois. (Photo by Quinn Harris/Getty Images)
4 of 6
Next

The St. Louis Cardinals had a great finish to their 2021 season. Looking back, what are five advanced statistics that are key signs for future success?

Everyone could use a little more baseball in their lives right now, and despite the gloom and doom of living in an MLB lockout, we can still pour over last season’s results. The St. Louis Cardinals were knocked out of the playoffs in the Wild Card game, but the final month’s push was a ton of fun to watch.

As we do most winters, there are millions and millions of different ways to look at what the heck happened last season. With all of baseball’s advanced metrics, there are many ways to describe what we saw on the field.

Advanced stats are not every fan’s cup of tea, but like any statistic, they are tools in a toolbelt. Last winter, Tyler O’Neill’s advances in plate discipline signaled a breakout was coming and that is what fans got. Looking ahead to 2022, what are five advanced statistics that you should care about?

ST. LOUIS, MO – OCTOBER 03: Edmundo Sosa #63 of the St. Louis Cardinals hits a sacrifice RBI in the second inning against the Chicago Cubs at Busch Stadium on October 3, 2021 in St. Louis, Missouri. (Photo by Scott Kane/Getty Images)
ST. LOUIS, MO – OCTOBER 03: Edmundo Sosa #63 of the St. Louis Cardinals hits a sacrifice RBI in the second inning against the Chicago Cubs at Busch Stadium on October 3, 2021 in St. Louis, Missouri. (Photo by Scott Kane/Getty Images) /

Edmundo Sosa ranks 49th in the MLB in max exit velocity (114.6 mph)

One spot to applaud former St. Louis Cardinals manager Mike Shildt on how he managed the team in 2021 was his willingness to make changes at the shortstop position. By all accounts, it was not a good year for Opening Day starter Paul DeJong.

Outside of July, DeJong was terrible in 2021 and he lost playing time because of it. With his struggles, the opportunity was there for young Edmundo Sosa to step up and play in some big games down the stretch.

Known for his glove, Sosa had 8 DRS at shortstop playing in 113 games last season. His defense was as advertised, but it is his bat that will decide whether he’s a utility infielder or a starter at this level. In all, Sosa’s 104 wRC+ and .735 OPS is solid (better than DeJong), but there is one stat that shows more potential with Sosa and his bat. Maximum exit velocity.

Most fans have started to pick up on average velocity being important, but recently the discussion about max exit velocity and its usefulness has grown. In short, max exit velocity is an indicator of power that a player has. Now-top prospect Jordan Walker showed up on prospect radars because of his huge max exit velocity numbers, and Sosa, surprisingly, excels in this single data point stat too.

Registering a max exit velocity of 114.6 mph on this hit, Sosa ranks 49th in baseball which is good for the 93rd percentile in this stat. This isn’t an argument to say that Sosa is going to become a power hitter or anything like that, but it’s at least intriguing to see that he has that type of pop somewhere in his swing. Like any stat, it’s just one tool in a box full of lots of ways to describe something. For Sosa, this is an interesting thing to follow because it was the second-hardest hit ball of the season (the hardest and third hardest were hit by Justin Williams).

Harrison Bader #48 of the St. Louis Cardinals celebrates as he runs the bases after hitting a solo home run during the first inning against the Chicago Cubs at Busch Stadium on October 2, 2021 in St. Louis, Missouri. (Photo by Scott Kane/Getty Images)
Harrison Bader #48 of the St. Louis Cardinals celebrates as he runs the bases after hitting a solo home run during the first inning against the Chicago Cubs at Busch Stadium on October 2, 2021 in St. Louis, Missouri. (Photo by Scott Kane/Getty Images) /

Harrison Bader’s in-zone swing percentage (64.9%)

2021 was a huge year for Harrison Bader as the 27-year-old needed to produce to solidify his spot as an everyday player. Everyone knew about the speedy outfielder’s glove, but a black hole at the plate wouldn’t fly for a team that needs all the help it could get at the plate.

In the field, Bader won his first career Gold Glove in 2021, and at the plate, things improved too. Finishing the year with a full-season career-high wRC+ of 110, Bader also set career highs in doubles, and homers, and OPS. When Bader is not a defense-only player, his total value increases a ton and that was evident in his second-best fWAR of 3.4. This was second only to 2018, a year where Bader played in 35 more games.

I discussed the likelihood that Bader’s “breakout” year was sustainable in this article, but one of the biggest predictors of Bader’s success is something that is worth reiterating here. When Bader swings at more strikes, he’s going to have more success.

This idea seems very simple, but it’s been a weakness in Bader’s career. Overall, he’s swung at an average of 62.9% of the strikes he’s seen, solidly below the league average of 66.8%. In 2021, Bader swung at 64.9% of the strikes he saw which was the exact same percentage as 2018, his next best MLB season.

If Bader can continue to swing at strikes this much or even improve to league-average, his production at the plate should improve.

Tyler O’Neill #27 of the St. Louis Cardinals reacts as he walks to the dugout after their 3 to 1 loss to the Los Angeles Dodgers during the National League Wild Card Game at Dodger Stadium on October 06, 2021 in Los Angeles, California. (Photo by Harry How/Getty Images)
Tyler O’Neill #27 of the St. Louis Cardinals reacts as he walks to the dugout after their 3 to 1 loss to the Los Angeles Dodgers during the National League Wild Card Game at Dodger Stadium on October 06, 2021 in Los Angeles, California. (Photo by Harry How/Getty Images) /

Tyler O’Neill’s xwOBAcon (.550)

There are so many exciting underlying stats from Tyler O’Neill’s breakout 2021 season, but let’s just focus on one that sounds the silliest. xwOBAcon sounds complex, but if you understand wOBA, it is a couple of short jumps of understanding from there. From wOBA, you can understand that there is a calculated expected value for wOBA (which is xwOBA), and then you can isolate just the calculated xwOBA on contact (finally xwOBAcon).

As a sabermetric tool, it’s basically a way to measure how good a hitter was expected to be on balls that he made contact with. For Tyler O’Neill, this is important for a couple of reasons. First, Tyler O’Neill, in spite of his breakout .912 OPS and top-8 MVP finish in 2021, still strikes out a lot.

In fact, the biggest predictor of his breakout, his improved plate discipline in 2020, slid backward and his strikeout rate was in the bottom 4% of the league. However, when O’Neill does make contact, he does it really, really well. O’Neill’s .550 xwOBAcon was top 6% in the MLB in 2021 and confirms what I just said: when he made contact, it was expected that things would go pretty well for O’Neill.

I could’ve pointed to xSLG (which he underperformed in reality) or barrel% or any number of other advanced stats to argue that O’Neill’s breakout was no fluke, but his xwOBAcon was too fun to pass up pointing out. The real question moving forward is whether or not that strikeout rate will catch up to him, but if he keeps making the same quality of contact, there is nothing to worry about.
Adam Wainwright #50 of the St. Louis Cardinals pitches in the first inning of game one of a doubleheader against the Atlanta Braves at Truist Park on June 20, 2021 in Atlanta, Georgia. (Photo by Todd Kirkland/Getty Images)
Adam Wainwright #50 of the St. Louis Cardinals pitches in the first inning of game one of a doubleheader against the Atlanta Braves at Truist Park on June 20, 2021 in Atlanta, Georgia. (Photo by Todd Kirkland/Getty Images) /

Adam Wainwright’s curveball spin rate (2839 rpm)

Adam Wainwright continued to defy Father Time in 2021 with yet another great season at yet another year older. Pitching part of the year at the age of 40, Wainwright has joined the company of few pitchers who still find success in the MLB in their fourth decade of life.

Coming into 2022, Wainwright and Yadier Molina are both likely on the final ride of their long and storied careers. While there’s nothing that can happen to tarnish their legacy in St. Louis, everyone wants them to go out with a bang rather than a whimper.

When looking at the key to Adam Wainwright’s success this late in his career, it comes from location, sequencing, using the defense, but also a healthy reliance on the curveball that has been his trademark for his whole career. As has been the case most of his career, Wainwright threw the curve more than any other pitch (33.8%) in 2021 and as far as looking towards 2022, there are no signs that the pitch is slowing down.

When you think about a pitch’s spin rate, it is one piece of the puzzle that describes what happens between the pitcher letting go of the ball and then the ball reaching home plate. Orientation, spin axis, and efficiency all matter in creating the movement of a pitch, but the spin rate is easiest to understand when it’s thought of like the horsepower of a car.

For Wainwright and his curve, the spin rate has only gotten better with age. Ranked in the 90th percentile in 2021, Waino’s curve actually had never averaged a higher spin rate (since tracking began in 2015) than the 2839 rpm fans saw in 2021. While changes to the ball and other things have impacted the horizontal and vertical break of Waino’s curve, this career-best spin rate fueled another great year from the pitch and probably means he’ll be able to keep spinning it well moving forward.

Nolan Arenado #28 of the St. Louis Cardinals bats against the San Francisco Giants in the top of the first inning at Oracle Park on July 05, 2021 in San Francisco, California. (Photo by Thearon W. Henderson/Getty Images)
Nolan Arenado #28 of the St. Louis Cardinals bats against the San Francisco Giants in the top of the first inning at Oracle Park on July 05, 2021 in San Francisco, California. (Photo by Thearon W. Henderson/Getty Images) /

Nolan Arenado’s abnormally high pull percentage (45.8%)

Even by the end of the season, it’s unclear if the shock and awe of having Nolan Arenado finally in a St. Louis Cardinals jersey had worn off. Though his batting average and OPS dropped from his time in Colorado, Arenado was the first Cardinal since Matt Holliday in 2012 to reach 100 RBI and his defense was as advertised.

He’d be the first one to tell you he expected better in his first season in St. Louis, but I don’t think many fans were complaining about having him anchoring the cleanup spot in the lineup. Digging deeper into his full season of batting stats reveals something interesting though: Arenado pulled the ball more than ever in 2021.

For his career, Arenado has a Pull%/Straight%/Oppo% slash of 39.9%/37%/22.8%. He could be described as a pull hitter based on that, but in 2021 that line jumped to 45.8%/33.3%/20.8%. A full 5% jump in pull percentage is really what jumps out here, especially when you combine it with the knowledge that every single one of his homers was pulled to left field.

In 2020, Arenado had a down year at the plate during the shortened season and it was revealed by Arenado himself that he had been playing through a shoulder injury for most of the year. According to MLB.com’s Thomas Harding in the article linked above, “The pain [was] inhibiting his ability to “lift” the ball with his swing.”

Losing Luis Garcia may help St. Louis Cardinals upgrade bullpen. dark. Next

I’m not going to go full out onto a limb and say that Arenado’s shoulder is still injured, but a change as large as fans saw in 2021 when talking about pulling the ball could mean that the injury changed his swing mechanics, or impacted it in some other way that could still improve over time. This change could also be explained by a change in approach, the pressure he’s putting on himself to perform, or any number of other reasons that could be just as plausible. All I am arguing is that this change in batted ball profile needs some attention, regardless of the reason.

Next